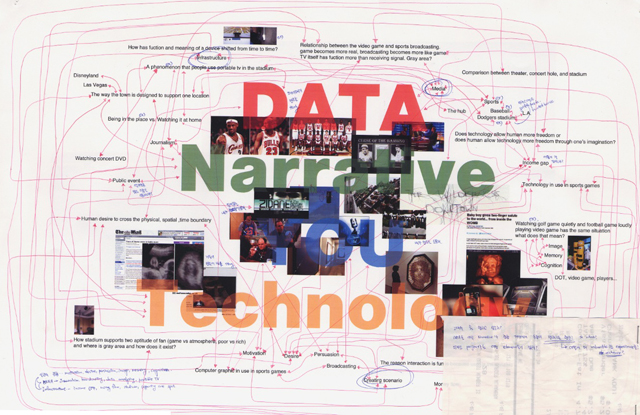
Before I started this term, I wanted to explore how data is utilized to create a story and how a story is delivered to fascinate the audience. Through the process of making a relational diagram, I started with two aspects which I found interesting: sports and storytelling. Upon laterally thinking, my interests and thesis topic have expanded to cover the following: data, narrative, technology, you.
The reason for the expansion of topics for my thesis to include technology is because of my first assignment. From having attended a sporting event at the Dodgers stadium, it became clear that there is a close relationship between broadcasting and technology. It seemed impossible to explore other keywords -data, narrative and user- without considering technology.
Public events are another element that I discovered from the first assignment. It will be interesting to look at the infrastructure and influence of public events on its surroundings. Throughout the research process, I'd like to look at what kinds of technology and strategies are used to fulfill the needs of public event attendees.
Although sports do not need to be a core theme in my thesis, I've found most of my inspiration and examples of what I'd like to discuss from this topic. Thus, sports events will be used as part of the investigative research to extrapolate phenomena that can also be applied different public events.