COWdata
Defining a data set to gain insight
When thinking about what data set might be a good space to gather insight, ‘Project Moo (roam)’ came to mind.
Project Moo (roam)
This is an ongoing project, begun in 1995. The idea was conceived while standing in a cow field, thinking of my self as a cow. What emerged is a documentation of a peripatetic bovine, calmly observing life, as it is, in our global environment. The project represents a study in time and is added to on a continual basis. Over the course of the past ten years a considerable archive has been achieved.
Date completed: 04.20.05
Materials: Laser prints, paper clips, a copper cow and twine.
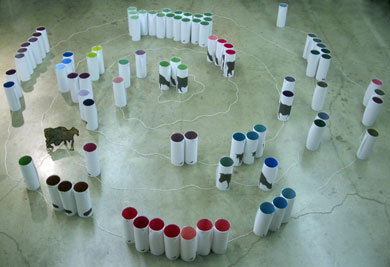
The spiral line represents a time segment of all animals the copper cow has been photographed with over a five years (2000-present). The center of the spiral is the starting point (the first animal photo). The end of the spiral is the most recent photo taken. The length of the line was determined by adding up the weight and height (I used a general average for all relevant species) of all the animals from each photo; there are 74 animals. I then converted this into a length of twine. This was my way of considering the sheer mass of all the animals in the instillation. The spiral became a good solution in considering how I might specialize geographic locations of photos taken over the course on time.
Each animal is laser printed on a piece of 8.5x11 sheet of paper. All the animal prints are scaled accordingly to the copper cow. The prints are rolled to form a cylinder and held with paper clips. The inside of each animal cylinder has a unique color. This color refers to a moment of time in a day. I started with a color pallet consisting of 1440 colors (the minutes of 24 hours, a day). The placement of the animals is best described by looking at the space between cylinders on the spiral line. This in between space is the time frame picture were not taken. All the animals have a particular relationship to each other in consideration of the length of the spiral line.
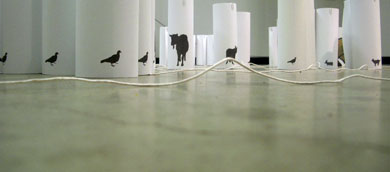
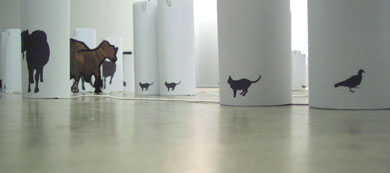 Detail with copper cow
Year10
My first consideration in gathering this data was to find a way to organize the documentation of the cow photos. I tuned to flickr, an online photo management and sharing application; that offers a good tool set for organizational purposes.
Insightful goals
This is a list of general investigations to initiate process. I used the data to help realize patterns within the data to help determent new direction(s) for the future of the project.
-Time line (10 years) or in parts
-Behavior, tendencies and narratives
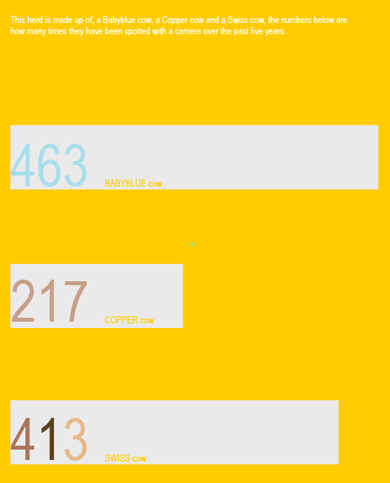
-About the herd
-The time when pictures are not taken
-The places they go
-Night picture vs. daytime
-Time of year (seasonal)
-Favorites
-Participants in the project (other people contributing photos)
-Geographic location
-Dates of travel
-Patterns of recurrence,
-The unknown images?
Process (visual investigations)
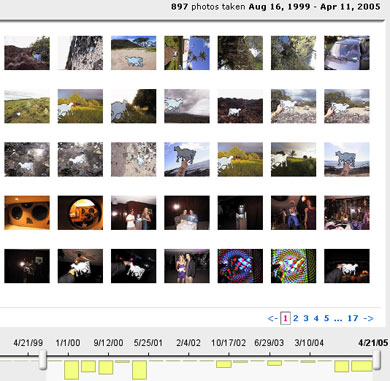
This image show reference to the data set, 1093 photo.
Investigations 01
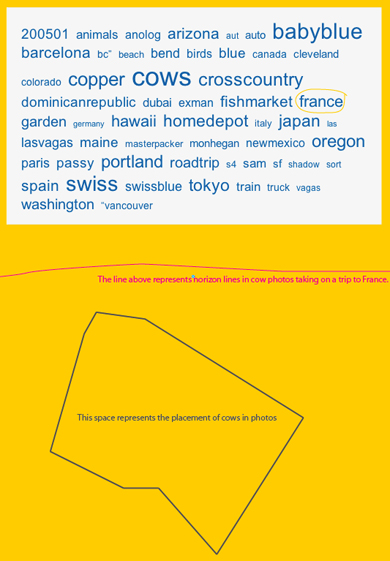
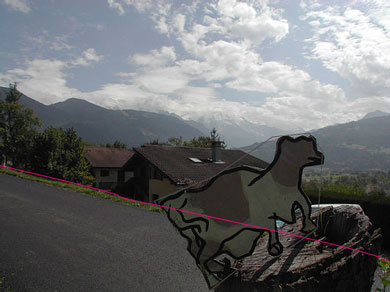
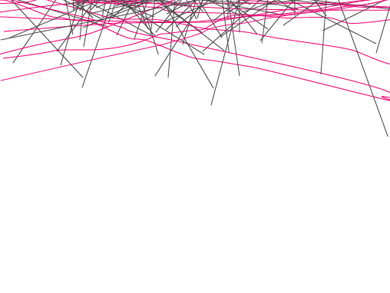
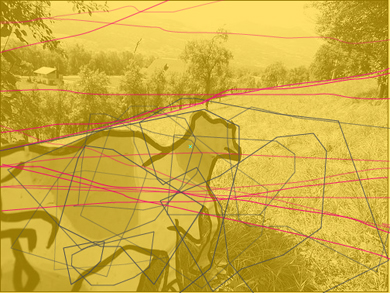
The text on top of this image shows all the ‘Tags’. I chose the ‘France tag’ because the majority of the images were landscapes. I wanted to investigate the relationship between the horizon lines in relation to the placement of cows.
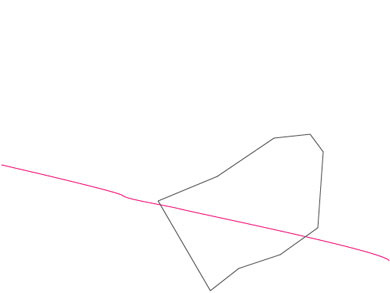
lines with out photo
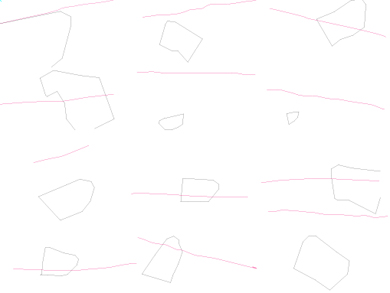
A representation of 12 photos
Another view
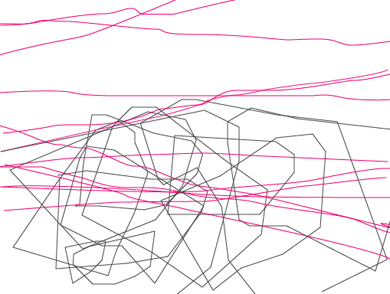
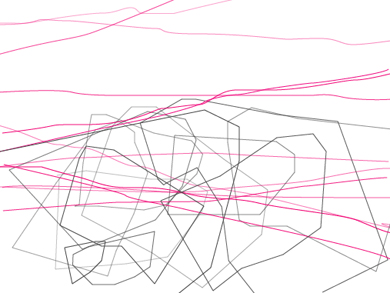 The layers of transparencey show sequencing of photos being taken over time.
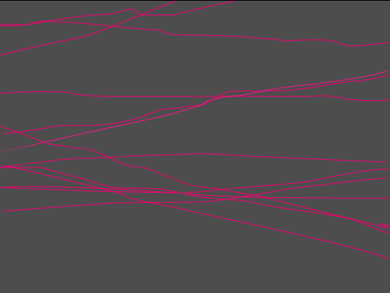
horizon lines
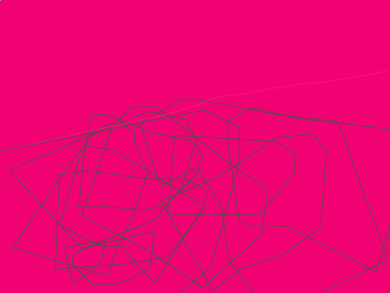 cow lines
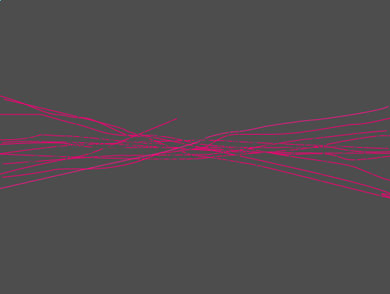 horizon lines centered
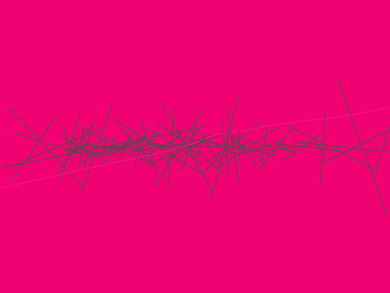 broken cows
 broken cows and horizon lines on top
Investigations 02
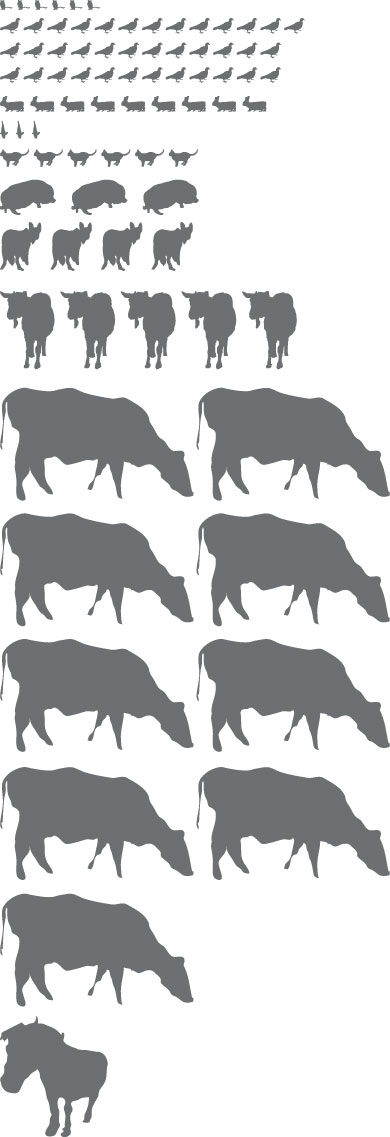 This investigation looked at how many animals the cow visited over a five year time period. The image shows how many and what kinds of animals were encountered. Silhouettes of animals were taken from the photos and are displayed here in relative size to each other.