Basics of Interplanetary Flight

ART CENTER COLLEGE OF DESIGN PUBLIC PROGRAMS
CLICK IMAGE FOR REFERENCE PAGE
|
Spectroscopy
View this page online: http://people.artcenter.edu/doody/spectro
Data from optical spectroscopic instruments can lead to knowledge of many of a light
source's properties. Depending on the nature and condition of the source
this may include temperature, pressure, density, luminosity, chemical composition,
state(s) of ionization, rotation rate, relative velocity, mass (under some
specific circumstances), surface composition and properties, and the composition and density of material intervening
between the source and the instrument.
Consider how many wavelengths or colors comprise white light. Given its
strength here on Earth, sunlight can be broken down into its constituent wavelengths with enormously fine resolution; thousands of individual wavelengths and meaningful features can be measured in the solar spectrum.
Caution: Don't ever look directly at the Sun with a spectroscope or as a reflection off a DVD etc, because it can injure the eye. Look instead at the sky or at a sunlit cloud.
Optical spectroscopic instruments have
led to many important findings. A few examples include:
- The discovery and naming of a mysterious, light-absorbing substance in
the Sun (the gas "helium") before it was identified on Earth;
- Compositions of solar system objects' atmospheres and surfaces;
- Clouds containing complex organic compounds in interstellar space;
- The expansion of the universe;
- Confirmation of liquid on the surface of Saturn's moon Titan.
Compare:
- Spectroscope,
- Spectrometer,
- Spectrograph,
- Spectroscopy.
There are many variations, but in a nutshell, "The basic function of a spectrometer is to take in light, break it into its spectral components, digitize the signal as a function of wavelength, and read it out and display it through a computer. The first step in this process is to direct light … into the spectrometer through a narrow aperture known as an entrance slit. The slit vignettes the light as it enters the spectrometer. In most spectrometers, the divergent light is then collimated by a concave mirror and directed onto a grating. The grating then disperses the spectral components of the light at slightly varying angles, which is then focused by a second concave mirror and imaged onto the detector. " (from bwtek.com/spectrometer-introduction). This reference has good characterizations of components such as the entrance slit, diffraction gratings, and detectors.
Kirchhoff's three laws of spectroscopy
- A hot solid object produces light with a continuous spectrum.
- A hot tenuous gas produces light with spectral lines at discrete wavelengths (colors) which depend on the energy levels of the atoms in the gas.
- A hot object surrounded by a cool tenuous gas (i.e. cooler than the hot object) produces light with an almost continuous spectrum which has gaps at discrete wavelengths depending on the energy levels of the atoms in the gas.
Kirchhoff did not know about energy levels in atoms. The existence of discrete spectral lines was later explained by the Bohr model of the atom, which helped lead to quantum mechanics.
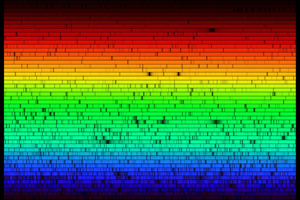
 Activity with Absorption Spectra
- Examine a hardcopy of a high-resolution solar spectrum.
- Identify absorption lines (dark gaps) and consider their origin.
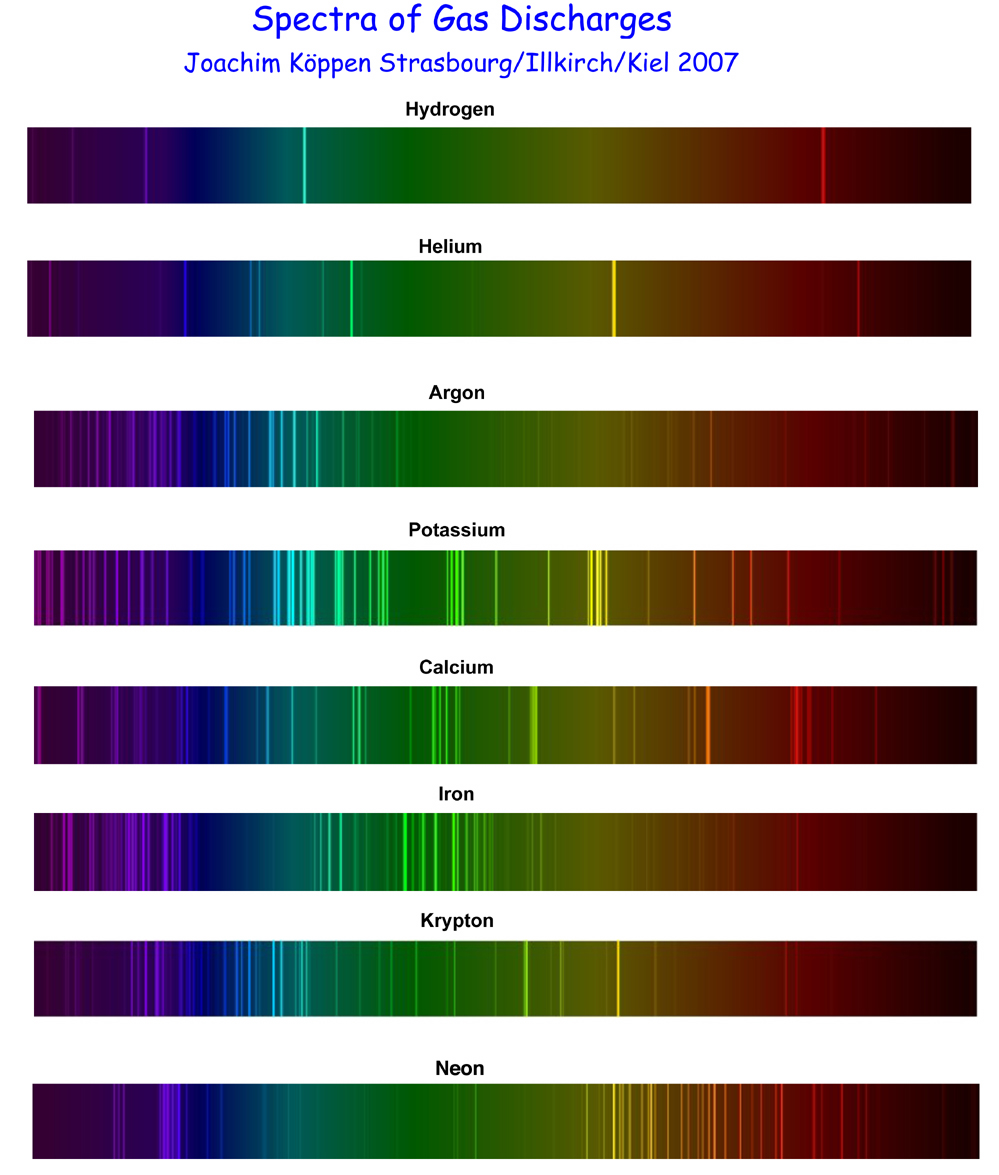
Activity with Emission Spectra
Refer to the image at right (click to enlarge):
- Experiment with a makeshift DVD spectroscope, a white light source, and a neon bulb.
- Observe the light emitted by each of various hot-gas lamps, using spectral gratings to observe emission lines.
- If you're operating the lamps, please observe 30 seconds maximum ON time with at least 30 seconds OFF time.
- Match the emission-line "fingerprints" that you observed with samples at right, thus identifying the gas in the lamp.
For Reference:
BACK TO MAIN PAGE
PAGE UPDATED 2014 JUNE 1 -dd
|